
After making a splash at IGNITE 2023, eprentise and Crystallize Analytics present an encore of their Data Visualizations webinar.
There are insights in your accounting and operational data that you can’t see in tabular or report form. Powerful, but underutilized audit superpowers are exploratory data visualizations that can give you x-ray vision and help you see the hidden stories your organization’s data is telling. This session will teach you five simple, but powerful data exploratory analytics with real Power BI and Excel use-case examples that you can begin using in your audit shop immediately.
Learning Objectives – After this session you will be able to:
- Understand the difference between explanatory charts and graphs and exploratory data visualizations
- Learn five exploratory data analytics for auditors using either Power BI or Excel
- Understand how to follow up on data analytics results to develop clear and well documented audit findings
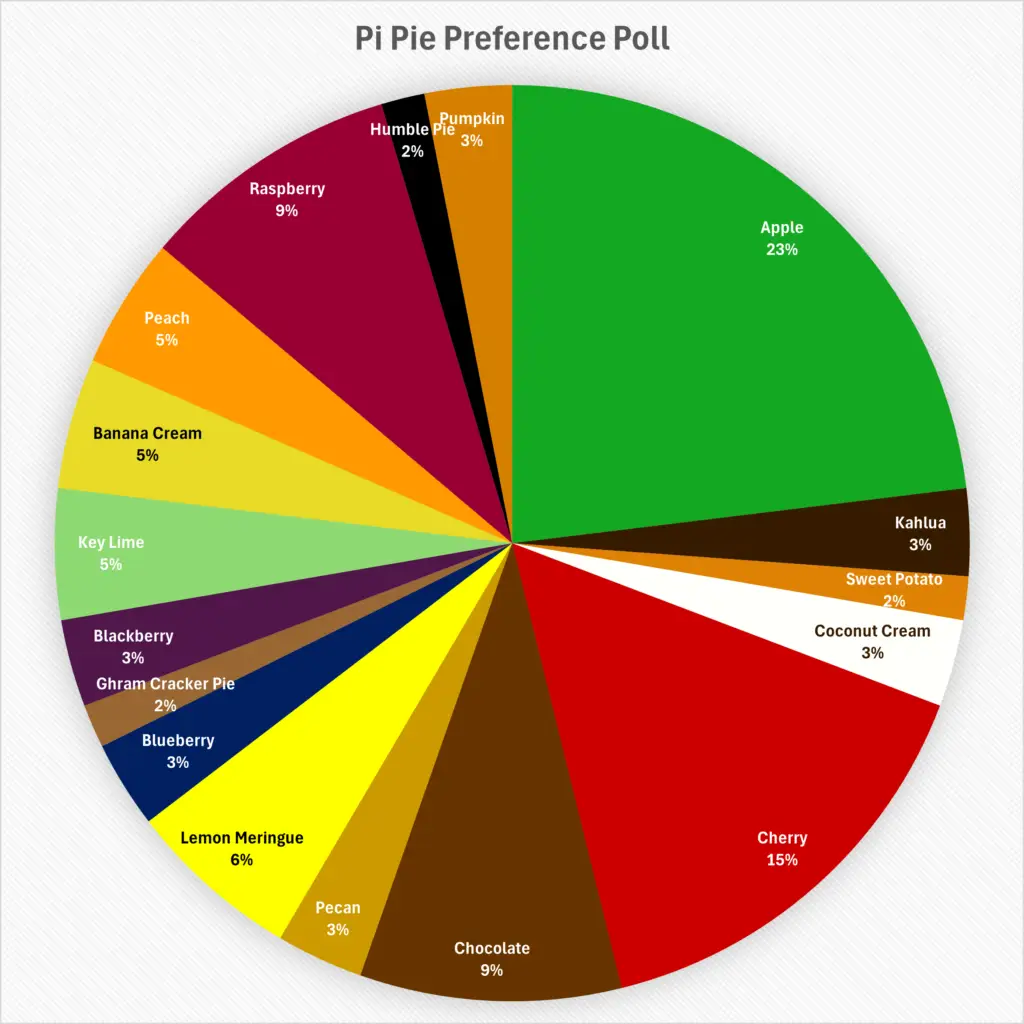
Also, if you joined us live and stayed for our Pi Pie Preference Poll, we hope you enjoy the results of all of our attendees’ favorite pie flavors, and for extra pi day fun, here is an article from the local paper at our Orlando, Florida headquarters:
What’s Pi Day all about? Math, science, pies and more